Seeing the Invisible
In the world of microservices and Kubernetes, you can't manage what you can't measure. Enter the dynamic duo of observability: Prometheus and Grafana.
Prometheus: The Time-Series Powerhouse 
Prometheus is an open-source systems monitoring and alerting toolkit.
- Pull Model: It scrapes metrics from your applications via HTTP endpoints (usually
/metrics). - PromQL: A powerful query language to aggregate and analyze data.
- Service Discovery: It knows exactly where your Kubernetes pods are.
Grafana: The Beautiful Dashboard 
If Prometheus is the engine, Grafana is the dashboard.
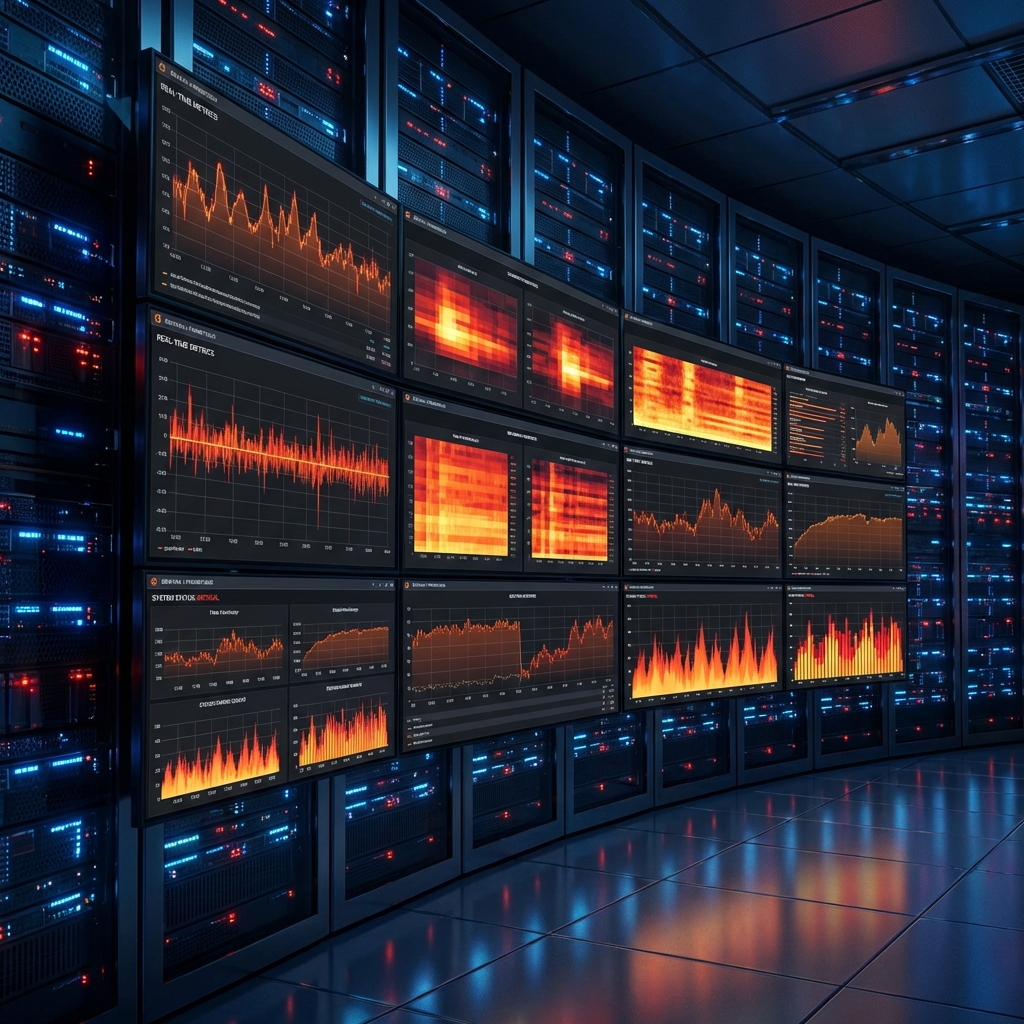
- Visualization: Visualize CPU spikes, memory leaks, and request latency in beautiful, dark-mode graphs.
- Alerting: Send notifications to Slack or PagerDuty when things go wrong.
- Data Sources: It connects not just to Prometheus, but also SQL databases, Elasticsearch, and more.
Why They Work Together
- Metric Storage: Prometheus stores the data efficiently.
- Metric Display: Grafana queries Prometheus to build insightful dashboards.
Together, they provide the visibility needed for SRE (Site Reliability Engineering) teams to ensure 99.99% uptime.